ODP Legacy > Scientific Results > Leg Summaries > Leg 169 >
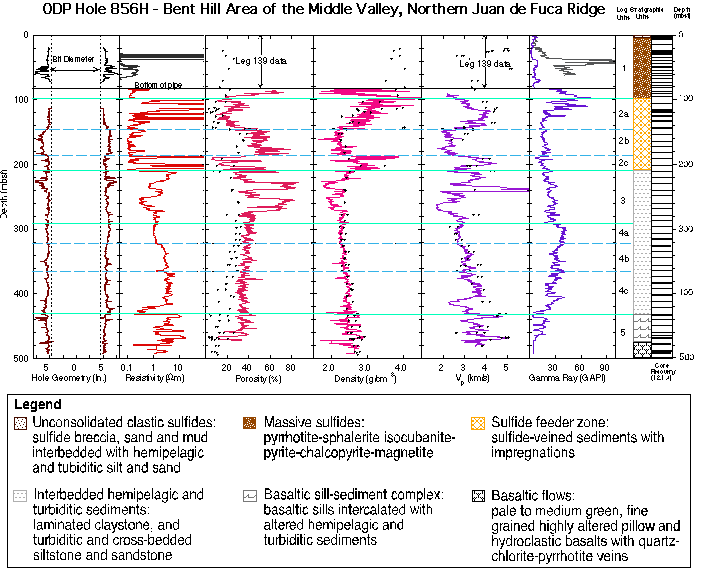
Downhole and discrete physical properties measurements from Hole 856H. Log units and stratigraphic units well as core recovery are also illustrated. Black symbols in porosity, density, and velocity curves represent shipboard laboratory measurements uncorrected for pressure and temperature effects. Discrepancies between laboratory and log measurements in the porosity curve are probably due to the presence of bound water within the claystones.
Program administration |
Scientific results |
Engineering & science operations |
Samples, data, & publications |
Outreach |
Overview |
Site map |
Search |
Home
For comments or questions, please contact webmaster@iodp.tamu.edu.
Copyright Consortium for Ocean Leadership