ODP Legacy > Scientific Results > Leg Summaries > Leg 176 >
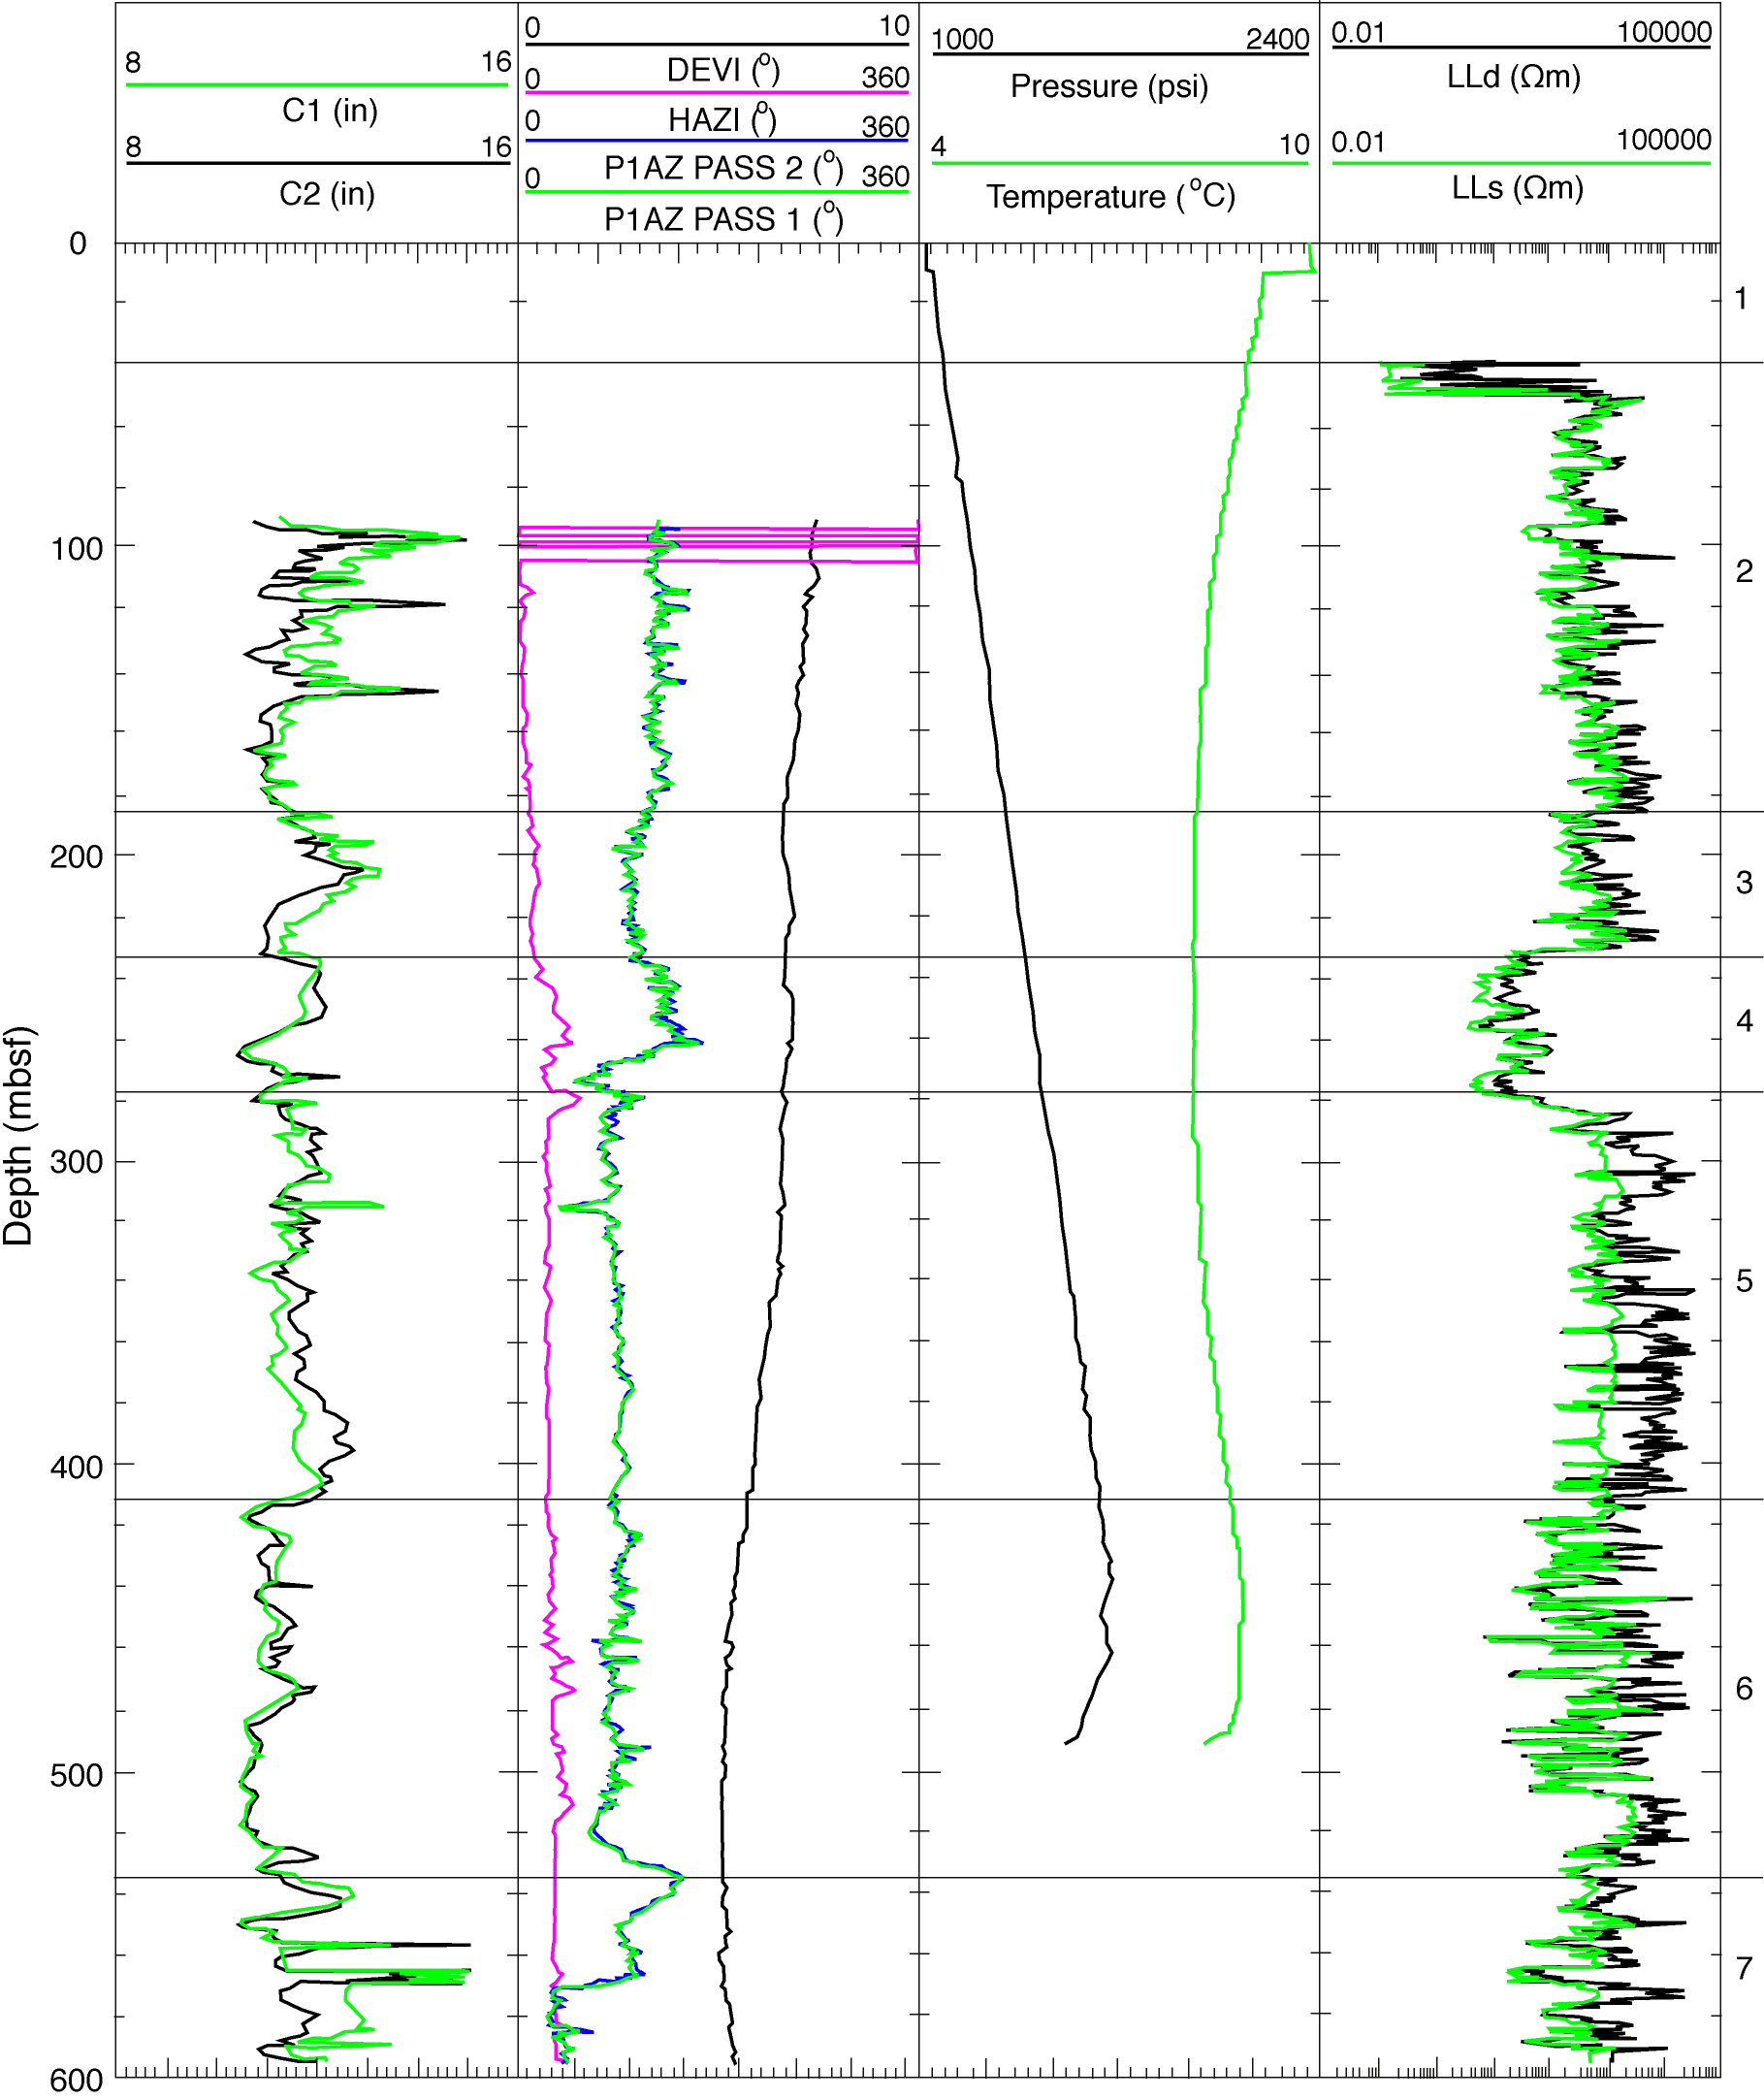
Composite illustration of Hole 735B logs. Plot showing the FMS calipers (C1 and C2) in track 1; hole deviation (DEVI), hole azimuth (HAZI) and FMS pad 1 azimuth for both passes in track 2; borehole pressure and temperature in track 3; and laterolog deep (LLd) and shallow measurements in track 4. The bottom scale in the plot axis shows the scale increments for the bottom-most curves displayed above the plot and the top scale shows the increments for the top-most curves shown above the plot.
Program administration |
Scientific results |
Engineering & science operations |
Samples, data, & publications |
Outreach |
Overview |
Site map |
Search |
Home
For comments or questions, please contact webmaster@iodp.tamu.edu.
Copyright Consortium for Ocean Leadership