ODP Legacy > Scientific Results > Leg Summaries > Leg 186 >
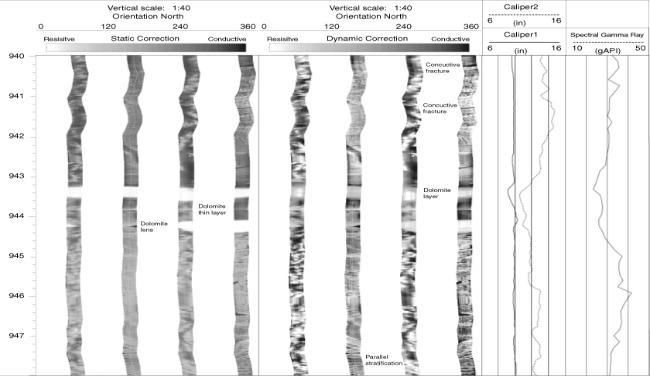
FMS images across a carbonate zone at 943.3-944.4 mbsf in Hole 1150B, which were recovered in Core 186-1150B-26R and were correlated to major seismic reflector. The images show the carbonate zone consists of two parts: relatively resistive beds with conductive features (bioturbation?) below and relatively conductive beds with fractures above. The images to the left are displayed with a range of resistivity values that are fixed for the entire logged interval (static correction); the images at the right allow for a greater range of grayscale to be displayed using normalized gains for a smaller user-specified depth interval (dynamic equalization). Both images are from 940 to 948 mbsf.
Program administration |
Scientific results |
Engineering & science operations |
Samples, data, & publications |
Outreach |
Site map |
Search
For comments or questions, please contact webmaster@iodp.tamu.edu.
Copyright Consortium for Ocean Leadership