
Leg 186 Logging Summary
Shipboard Scientific Party
Summary
During ODP Leg 186 two sites were drilled down to 1200 mbsf on the lower slope in the NE Japan forearc. Quaternary to middle Miocene diatomaceous silty clay and claystone were recovered in Sites 1150 and 1151. Downhole logging was deployed and excellent data including natural gamma-ray, resistivity, bulk density, sonic velocity and FMS images were successfully logged at these two sites. The sediments were characterized by high porosity (more than 70%) and low resistivity (less than 0.7 ohm-m) in the upper part and discontinuous lithification in the lower part.
Dewatering, consolidation, and lithification processes at Site 1150 are well recorded in logs:
- normal dewatering and consolidation from 0 to 100 mbsf;
- pore water preventing the consolidation from 100 to 600 mbsf due to high pore pressure,
- dewatering and consolidation proceeding from 600 to 1050 mbsf,
- lithification from 1050 mbsf downward. The vertical variations in physical and hydrologic properties are strongly related to structural frame of diatoms and frequent occurrence of dolomite layers.
Introduction
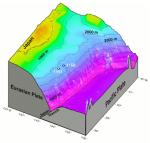
The Leg 186 Scientific Party sailed out to investigate the dynamic properties of one of the world's most active plate subduction zones, the Japan Trench, where the oldest oceanic plate (>100 Ma) is subducting at a high rate (~100 km/m.y.). The drill sites are located about midway within the Japan Trench zone, which is ~650 km long (Fig. 1).
 |
|
|
The prime objective of this leg was to establish two geophysical observatories that monitor strain, tilt, and seismic waves to further our understanding of subduction dynamics. Coring and logging were aimed at gathering information about past and present tectonic and paleoceanographic conditions.
The drilling program was designed to enable us to understand:
- Dynamic Sliding of the Subducting Plate and Earthquake Process
- Earthquake Source Studies
- High-Resolution Geometry of the Plate Boundary
- Miocene and Younger Volcanic Ash Stratigraphy in the Western Pacific
- Subsidence History Across the Continental Slope to Constrain the Processes of Tectonic Erosion
Downhole measurements were used to determine the lithology where core recovery was poor, continuous in situ physical properties, geologic structures, and thermal structure in the sediments above the seismogenic zone. These measurements also enabled us to evaluate, in real time, the borehole conditions such as hole geometries, stress, and stabilities in the lower part of the borehole where downhole instruments were expected to be installed. Logs also provide high resolution records that will be used to study the paleoceanographic history in the Western Pacific region and the nature of compaction, lithification, and deformation processes in the drilled forearc region. Logs are also used to generate synthetic seismograms for be comparison with field seismic records to correlate reflections with drilled geological boundaries.
Operation overview
Site 1150
Five logging runs were performed from July 1-3, 1999. An obstruction was encountered at 646 mbsf during the first run, and so the Triple Combo was logged up from 646 mbsf to the seafloor. The wireline heave compensator was used on all descents and performed well because maximum ship heave was about 3 m for most of the operations. As another obstruction was encountered at 473 mbsf during the second run, the FMS-DSI string was logged up from 473 mbsf to the seafloor. After the pipe was lowered to 742 mbsf, the third run went within seven meters from bottom without any problems. The Triple Combo was logged up from 1174 to 660 mbsf. The FMS-LSS string was deployed in the fourth run in the interval of 1174 to 713 mbsf. Finally, the BHTV string was deployed in the fifth run in the interval of 1174 to 731 mbsf.
Site 1151
Two logging runs were performed on August 11-12 , 1999. The FMS-LSS and the Triple Combo string was logged up from 868 mbsf to the mudline.
Data quality
Site 1150
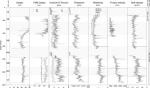
The wireline logs recorded in Holes 1150B are shown in Figure 2; they are generally of high quality except for the neutron porosity log due to large borehole enlargement. Density, resistivity, sonic, and FMS data recorded in the drill pipe are not interpretable. The natural gamma-ray logs in the pipe are highly attenuated and should be interpreted only qualitatively.
 |
|
|
The hole diameter was enlarged in the interval 200-350 mbsf, possibly because of washouts within low-porosity zones; as a result, the FMS images in these sections are degraded. The density log in this interval is of high quality because of good contact with the borehole regardless of washouts. The FMS calipers in the third run revealed that the hole generally has oval shape with a short axis of 10 inches and a long axis of 14 inches. The image quality along the short axis is very good, whereas that along the long axis is less desirable due to the rugosity. The compressional velocity data from the DSI and LSS logs are of high quality. A minor amount of cycle skipping is present in the raw data, but shipboard processing of the traveltime eliminated these excursions. Thin intervals of especially abrupt velocity changes corresponded to hard thin layers or washouts. The overall quality of BHTV data is poorer than what was originally expected and difficult for interpretation at this site, because the formation/borehole impedance ratio (~2 at this site) is much lower in the diatomaceous claystone than the normal range (~10) for the tool.
Site 1151
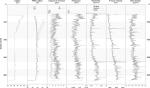
The wireline logs recorded in Holes 1151D are shown in Figure 3; they are generally of high quality except for the neutron porosity log. Density, resistivity, sonic, and FMS data recorded in the drill pipe are not interpretable. The natural gamma-ray logs in the pipe are highly attenuated and should be interpreted only qualitatively.
 |
|
|
The hole diameter was enlarged in the interval 110-320 mbsf, possibly because of washouts within high-porosity zones. The FMS calipers revealed that the hole generally has circular shape with 30 cm in diameter in the interval of 320-868 mbsf, whereas it has an oval shape with a short axis of 27-30 cm and a long axis of 30-38 cm in the upper interval. The compressional velocity data from the LSS log are of high quality. A minor amount of cycle skipping is present in the raw data, but shipboard processing of the traveltime eliminated these excursions. Thin intervals of especially abrupt velocity changes corresponded to hard thin layers.
Results
Bulk Density
Site 1150
In situ bulk density measurements were collected by the HLDS as a part of the Triple Combo string. Downhole density measurements correlate closely with core measurements, although downhole densities are higher than the core-based values throughout the logged intervals as expected due to core decompaction and disturbance
Bulk density values in the Lithologic Unit I decrease with depth from 1.6 to 1.4 g/cm3 starting a depth at 120 mbsf. A large excursion, which reaches values as high as 1.95 g/cm3, occurs at the interval of 137 to 138 mbsf. This peak coincides with the boundary between Lithologic Subunits IA and IB and may be caused by pebble clasts in Section 186-1150A-16X-1.
Bulk density values fluctuate mainly between 1.4 and 1.5 g/cm3 in Lithologic Unit II. Large excursions up to 2.2 g/cm3 occur at the intervals 440-441, 472-473, and 474-475 mbsf. The excursion in the interval 440-441 mbsf can be correlated to a 12 cm-thick dolomite layer in the core. An increase in bulk density to 1.6 g/cm3 occurs at 594 mbsf, corresponding to the boundary between Lithologic Units II and III.
Bulk density values in Lithologic Subunit IIIA fluctuate mainly between 1.4 and 1.6 g/cm3. A large excursion up to 2.2 g/cm3 occurs at the interval 602-604 mbsf. An abrupt increase in bulk density from 1.5 to 1.7 g/cm3 occurs at 794 mbsf, corresponding to the boundary between Lithologic Subunits IIIA and IIIB. Bulk density values in the Lithologic Subunits IIIB and IIIC fluctuate in a range of 0.1 g/cm3 and decrease with depth from 1.65 to 1.55 g/cm3. A large decrease in bulk density occurs at 920 mbsf and can be correlated to the boundary between Lithologic Subunits IIIA and IIIB. Large excursions up to 2.2 g/cm3 occur at 810 and 946 mbsf. The excursions can be correlated to a 5 cm-thick dolomite layer recovered in Core 186-1150B-12R and a 17 cm-thick dolomite layer recovered in Core 186-1150B-26R.
An increase in bulk density from 1.5 to 1.7 g/cm3 occurs at about 1050 mbsf, corresponding to the boundary between Lithologic Units III and IV. The average value of bulk density is about 1.7 g/cm3 throughout the unit. A number of large excursions as high as 2.0 g/cm3 occur at the intervals 1055-1063 mbsf. One of the excursions can be correlated to a ~20 cm-thick carbonate-rich layer observed in Core 186-1150A-38R. A large excursion of low density values of less than 1.2 g/cm3 is identified in the interval of 1066-1067 mbsf, which corresponds to a large washout identified by the caliper logs.
Site 1151
In-situ bulk density was measured with the HDLS tool, which is part of the Triple Combo string. The downhole trends of log and core density measurements are closely correlated, but log measurements are generally about 0.1 to 0.2 g/cm3 higher than the discrete core measurements in the upper part of the hole with soft lithologies. This discrepancy is expected, because of core decompaction and drill disturbance. Consequently, the different between log and core measurements decreases gradually with depth as sediment become more indurated (?), and log and core values have similar magnitudes in from about 700 mbsf.
Bulk density generally ranges from 1.4 to 1.7 g/cm3 in Hole 1151D, but spike values up to 2.5 g/cm3 are occasionally measured (Fig. 3). Bulk density decreases with depth across Lithologic Unit I, from about 1.6 g/cm3 at the base of the drill pipe to 1.4 g/cm3 at 296 mbsf. A small excursion from this trend (i.e., slightly increasing values) occurs between 200 and 240 mbsf. A shift to rather constant values occurs across Lithologic Unit II (296-407 mbsf), and bulk density generally ranges from 1.4 to 1.6 g/cm3. Infrequent higher values are measured in the upper section of the unit.
Bulk density values in lithologic subunit IIIA generally fluctuate between 1.5 to 1.6 g/cm3. A significant excursion with bulk density ranging between 1.4 and 1.8 g/cm3 occurs from 452-467 mbsf. The width of the scatter in bulk density increase from about 1.5 to 1.6 g/cm3 in this subunit. At 647 mbsf, the maximum bulk density (2.5 g/cm3) of Hole 1151D is measured in a dolomite layer. Bulk density values fluctuate around 1.6 g/cm3 in lithologic subunit IIIC (719-817 mbsf) with a range of 0.1 g/cm3. This interval furthermore includes a spike value in bulk density at 768 mbsf. Only the upper 40-m of lithologic unit IV was logged, and bulk density generally decreases from 1.7 to 1.5 g/cm3 in this interval.
Sonic Velocity
Site 1150
In situ sonic velocity measurements were acquired by the DSI and LSS tools. In this hole, the upper interval (from 500 to 150 mbsf) was logged by the DSI tool and the lower part (from 1162 to 740 mbsf) was logged by LSS tool. Borehole-compensated P-wave velocity in the upper part shows a gradual increase from 1600 to 1800 m/s with depth. These values are slightly higher and fluctuate more widely than the P-wave measurements from discrete core specimens. In the upper part of the hole where the DSI sonic tool was used, the velocity values for dolomite layers are lower than expected, possibly because the tool was used in the Digital First Motion Detection mode instead of the normal operation mode due to the malfunction of an electronic part.
In situ P-wave velocity values in the lower part show better quality than the upper part. Velocity values in the Lithologic Subunit IIIA are in the range of 1700 to 1800 m/s. A large excursion up to 2100 m/s occurs at the top of the Lithologic Subunit IIIB. Velocity values in the Lithologic Subunits IIIB and IIIC fluctuate between 1750 and 1850 m/s in the interval of 791-865 mbsf and between 1800 and 1900 m/s in the interval of 865-1050 mbsf. Velocity excursions as high as 2300 m/s occur at 808 and 3300 m/s at 943-944 mbsf. The excursions can be correlated to a 5 cm-thick dolomite layer recovered in Core 186-1150B-12R and a 17 cm-thick dolomite layer recovered in Core 186-1150B-26R, respectively. Thin low-velocity excursion occurs at 1045 and 1064 mbsf, which corresponds to a major washout identified by the caliper logs. P-wave velocity increase gradually from 1900 to 2000 m/s in the interval between two washouts. A thin high-velocity excursion can be identified at 1056 mbsf, which can be correlated to a ~20 cm-thick carbonate-rich layer observed in Core 186-1150A-38R. The velocity values fluctuate around 2000 m/s below the two washouts.
Site 1151
In-situ sonic velocity was acquired in two passes with LSS tool, which is part of the FMS-Sonic toolstring. The downhole trend of log and core P-wave velocity measurements are similar, but the log measurements are generally about 100 m/s higher than the discrete core measurements. P-wave velocity generally increases from 1540 to 1850 m/s across the logged interval of Hole 1151D, although higher values are commonly observed across dolomite layers, for example at 273 and 648 mbsf. The maximum P-wave velocity (3800 m/s) of Hole 1151D is measured at 647 mbsf. The width of scatter in P-wave velocity increases from about 600 mbsf, which probably reflects the increasing occurrence of brittle structures in the logged sequence.
Electric resistivity
Site 1150 In situ electric resistivity measurements were collected by the DIT-E as parts of the Triple Combo string. The deep, medium, and shallow resistivity logs in Figure 2 show similar trends throughout the logged intervals, indicating good hole conditions. However, the shallow resistivity log in the Lithologic Unit I and Subunit IIA shows smaller amplitude due to borehole enlargement as indicated by caliper log.
Deep resistivity values in the Lithologic Unit I decrease with depth from 1.2 to 0.7 ohm-m. Major decreases in resistivity from 1.2 to 0.9 ohm-m, 1.1 to 0.8 ohm-m, and 0.9 to 0.7 ohm-m occur at 118, 139, and 175 mbsf, respectively. The resistivity increases in short intervals between these three depths. The same trend can be observed in bulk density log. Deep resistivity shows cyclic changes between 0.65 and 0.85 ohm-m and a gradual decrease with depth in the Lithologic Subunit IIA. The resistivity abruptly increases from 0.65 to 0.8 ohm-m at the top of the Lithologic Subunit IIB. The resistivity values fluctuate between 0.7 and 0.8 ohm-m and show several major cycles in the Lithologic Subunit IIB. Large excursions up to 1.4 and 2.1 ohm-m occur in the intervals 440-441 and 472-475 mbsf, respectively. The excursion in the interval 440-441 mbsf can be correlated to a 12 cm-thick dolomite layer in Core 186-1150A-47X. The resistivity value abruptly increases from 0.8 to 1.1 ohm-m at the top of the Lithologic Unit III. The resistivity fluctuates between 0.9 and 1.0 ohm-m in the Lithologic Subunit IIIA. An abrupt change in resistivity from 1.0 to 1.3 ohm-m occurs at 792 mbsf, corresponding to the boundary between Lithologic Subunits IIIA and IIIB. Resistivity values in the Lithologic Subunits IIIB and IIIC widely fluctuate in a range of 0.2 ohm-m and decrease with depth from 1.2 to 1.0 ohm-m. Large excursions up to 1.9 ohm-m occur at 810 and 1.7 ohm-m at 945 mbsf. The excursions can be correlated to a 5 cm-thick dolomite layer recovered in Core 186-1150B-12R and a 17 cm-thick dolomite layer recovered in Core 186-1150B-26R, respectively.
Low frequency cycles (50-100 m scale) and high frequency cycles (5-10 m scale) can be identified in the Lithologic Subunits IIIB and IIIC. An increase in resistivity from 1.1 to 1.4 ohm-m occurs at about 1050 mbsf, corresponding to the boundary between Lithologic Units III and IV.
Resistivity values in the Lithologic Unit IV fluctuate in a range of 0.1 ohm-m and decrease with depth from 1.4 to 1.1 ohm-m. A large excursion up to 1.9 ohm-m occurs at 1057 mbsf, which can be correlated to a ~20 cm-thick carbonate-rich layer observed in Core 186-1150A-38R. Negative excursions in shallow resistivity down to 1.0 ohm-m are identified at 1046 and 1066 mbsf, which corresponds to large washouts.
Site 1151
In situ electric resistivity measurements were collected by the DIT-E as parts of the Triple Combo string. The deep, medium, and shallow resistivity logs in Figure 3 show similar trends throughout the logged intervals, indicating good hole conditions. Resistivity values typically fluctuate in the range of 0.1-0.2 ohm-m and background values change between 0.75 to 1.15 ohm-m. Large excursions occur at about 110, 275, 500, 700, 710, and 830 mbsf, which can be correlated to dolomite layers.
Natural Gamma Ray
Site 1150
In-situ natural gamma-ray measurements were collected by HNGS in Hole 1150B (Fig. 2). The log responds to mineral composition and therefore indicates change in lithology. Potassium and thorium values show similar trend throughout the logged section, although potassium values are more sensitive and variable with depth. The potassium values show decreasing trend from 115 to 140 mbsf and increasing trend from 140 to 175 mbsf. A large decrease from 0.012 to 0.007 wt% occurs from 175 mbsf and a decrease down to 0.005 wt% with depth in the Lithologic Unit I. Lithologic Subunits IIA and B are characterized by regular oscillations of the range of 0.005 wt% in 10-20 m intervals. Relatively high-K (0.006-0.01 wt%) zones were identified in the intervals of 290-372 and 425-528 mbsf and low-K (0.004-0.008 wt%) zones were identified in the intervals of 215-290, 372-425, and 528-598 mbsf. Uranium values show regular oscillations between 1 and 2 ppm with ~70 m cycles throughout the Lithologic Unit I and Lithologic Subunit IIA. Several excursions in Th and K correspond to those of resistivity and density curves, suggesting volcanic ash layers in Lithologic Subunit IIB. The averaged potassium value yields 0.007 with relatively small fluctuations in the Lithologic Subunit IIIA. A large increase in K (0.008 to 0.013 wt%) and Th (2.5 to 4 ppm) occurs at the boundary between Lithologic Subunits IIIA and IIIB. In the Lithologic Subunit IIIB potassium values show regular oscillations between 0.007 and 0.012 wt% in ~5 m intervals. In the Lithologic Subunit IIIB, the averaged potassium value yields 0.008 wt%. In the interval 964-1030 mbsf, potassium values show regular oscillation between 0.005 and 0.012 wt% in 10 m intervals. An increase in K (0.008 to 0.012 wt%) and Th (3 to 5 ppm) occurs at the boundary between Lithologic Units III and IV. Two excursions as high as 0.015 wt% in potassium values occur in the intervals from 1047 to 1150 mbsf and 1150 to 1145 mbsf.
Site 1151
In-situ natural gamma-ray measurements were collected by HNGS in Hole 1151D (Fig. 3). Potassium and thorium values show similar trend throughout the logged section. Potassium values typically fluctuate in the range of 0.002-0.005 wt% and change between 0.003 to 0.015 wt%. Vertical variations of potassium and thorium are similar to that of density.
Borehole Geometries and Images
Electrical microresistivity images were recorded in the intervals of 170-473 mbsf and 713-1174 mbsf. FMS Caliper data document borehole geometries (Figure 2). In the upper part, Caliper-1 (C1) and Caliper-2 (C2) logs show similar values. The hole geometry above 400 mbsf was enlarged to more than 40 cm. C1 and C2 logs indicate different values of borehole diameters in the lower part. The azimuth of C1 and C2 is N-S to NNW-SSW and E-W to ENE-WSW respectively throughout the lower part. The C1 log shows constant values of 25 1 cm, whereas the C2 log changes from 30 to 35 cm, suggesting borehole shape is elongated in the E-W direction.
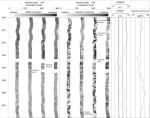
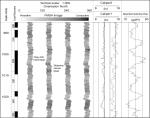
FMS images clearly show sharp resistive layers at 440.01-440.70, 793.43-793.55, 810.69-811.03, 945.81-946.05, and 1058.04-1058.52 mbsf. A typical image of sharp resistive layer from 943.3-944.4 mbsf is shown in Figure 4. The sharp resistive layer in the interval 442.0-422.7 mbsf can be correlated to a 12 cm-thick dolomite layer in Core 186-1150A-47X. The sharp resistive layer in the interval 808.1-808.5 and 943.3-944.4 mbsf can be correlated to a 5 cm-thick dolomite layer recovered in Core 186-1150B-12R and a 17 cm-thick dolomite layer recovered in Core 186-1150B-26R, respectively. The sharp resistive layer at the interval of 1055.7-1056 mbsf can be correlated to a ~20 cm-thick carbonate-rich layer observed in Core 186-1150A-38R.
The microresistivity images also demonstrate striped patterns that coincide with the variation in natural gamma-ray log (Figure 5). In the interval 820-870, 895-920, and 960-1030 mbsf, striped patterns can be identified clearly with ~5 m-, ~5 m, 10 m-frequency, respectively. These cyclic changes in microresistivity correspond to changes in resistivity, density, and natural gamma-ray logs. Resistive zones correspond to high-density and high natural gamma-ray zones.
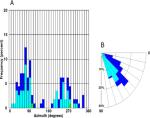
Conductive and resistive fractures were imaged by FMS. Preliminary shipboard analyses of fracture orientations from Lithologic Units III and IV are shown in Figure 6. Fractures are developed in ENE and WSW azimuths. These azimuthal data agree well with the magnetic-oriented core analysis. The fracture dips mainly range 20°-50° for conductive fractures and 40°-60° for resistive fractures. Fracture distribution in azimuth imaged by FMS coincides with the direction of borehole elongation indicated by FMS calipers.
Summary of core-log integration
Cyclic changes in sediment composition
The cores recovered from Site 1150 show quite monotonic sedimentary facies except for occasional ash layers and dolomite layers. Although several peaks in thorium indicate volcanic ash layers, natural gamma-ray logs were not generally useful for detecting ash layers. Carbonate/dolomite layers typically have weak negative peaks in gamma-ray. However, natural gamma-ray logs are useful in determining the lithologic change such as the diatom-clay ratio, which is a primary factor of the change in sedimentary composition throughout the whole section at Site 1150.
The composite profile made from natural gamma-ray logs and MST natural gamma ray counts indicate the composition changes in three different modes;
- first-order cycle; high gamma-ray in the interval from 0 to ~200 mbsf, low gamma-ray in the interval from ~200 to ~800 mbsf, and high gamma-ray in the interval from ~800 mbsf to the bottom,
- second-order cycles; medium scale fluctuations in 50-100 m intervals, which basically correspond to lithologic units and subunits,
- third-order cycles; regular oscillations in 5-20 m intervals.
The first- and second-order cycles coincide well with the vertical variations in the clay and opal concentrations shown by XRD analyses throughout the whole section. Natural gamma-ray logs contain third-order cycles, which record high-resolution compositional changes in sediments, mainly in Lithologic Unit II and Lithologic Subunits IIIB and IIIC. The third-order cycles can be observed in MST measurements (GRA density and natural gamma ray) in Lithologic Unit II. Low core recovery prevented identifying the third-order oscillation in Lithologic Subunits IIIB and IIIC from cores. However, several complete cycles were identified in Core 186-1150B-22R, 28-30R, and 32R and correlated well to the gamma-ray logs.
Dewatering, consolidation, and lithification processes
Resistivity logs recorded dewatering, consolidation, and lithification processes. The resistivity values increase discontinuously with depth at ~400, ~600, ~800, and ~1050 mbsf and correspond to the degree of lithification defined by the visual core description. Dolomite layers can be identified at the most of the discontinuities of resistivity values. Dolomite can be easily identified as large excursions in resistivity values and can be correlated well to core descriptions and XRD analyses. Although the resistivity values increase abruptly at ~400 and ~600 mbsf, bulk density values do not change very much. These two depths of changes in resistivity can be correlated to two major changes in salinity in interstitial water. At ~800 and ~1050 mbsf, the bulk density values increase with depth corresponding to the increases in resistivity values. However, no change in pore-water chemistry can be identified at the two discontinuities. The different responses in resistivity, bulk density, and pore-water chemistry suggest that hydrologic property may produce large effects on the electromagnetic property in 200-600 mbsf and pore space reduction affects the electromagnetic property of the formation from 600 mbsf to the hole bottom. Dewatering, consolidation, and lithification processes estimated from core and logs are:
- normal dewatering and consolidation from 0 to 100 mbsf;
- pore water preventing the consolidation from 100 to 600 mbsf due to high pore pressure,
- dewatering and consolidation proceeding from 600 to 1050 mbsf, and
- lithification from 1050 mbsf downward. The vertical variations in physical and hydrologic properties are strongly related to structural frame of diatoms and frequent occurrence of dolomite layers.
Logging Scientists
Yue-Feng Sun
LDEO Logging Scientist
Lamont-Doherty Earth Observatory
Columbia University
Saneatsu Saito
LDEO Logging Scientist
Ocean Research Institute
University of Tokyo
Maria V.S. Ask
JOIDES Logging Scientist
Department of Geology and Geochemistry
Stockholm University