ODP Legacy > Scientific Results > Leg Summaries > Leg 193 >
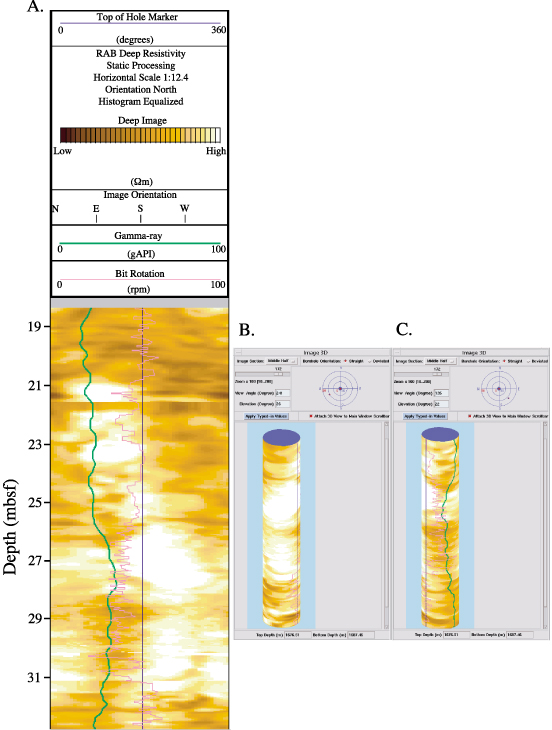
Detail image of deep resistivity measurements between 18.7 and 32 mbsf using a static normalization technique and 32 colors. Panels (B) and (C) show the same depth interval displayed in 3 dimensions but in two different orientations.
Program administration |
Scientific results |
Engineering & science operations |
Samples, data, & publications |
Outreach |
Overview |
Site map |
Search |
Home
For comments or questions, please contact webmaster@iodp.tamu.edu.
Copyright Consortium for Ocean Leadership