
Leg 203 Logging Summary
Shipboard Scientific Party
Introduction
ODP Leg 203 has been established to accomplish the second of three initiatives as prescribed in the ODP Long Range Plan (1996). In co-operation with the ION (International Ocean Network) Consortium a cased hole (designated OSN-2, Ocean Seismic Network-2) was drilled into the basement of the Pacific plate (Figure 1). It addresses the integration of a new ocean seismic observatory into the existing observatories OSN-1, south of Oahu and the proposed site H2O-1.

Figure 1. The drilling site for Leg 203 superimposed on a tectonic map of the world.
The specific site (named Site 1243) also provides information for an understanding of the interplay between ocean chemistry, productivity, climate, and plate tectonics in a young, fast-spreading crust. Drilling had to satisfy the guidelines of an ODP legacy hole as well as to fulfil the major scientific objectives (Leg 203 Preliminary Report). As such, apart from the proposed one-hole option two holes (Hole 1243A and 1243B) were drilled in the vicinity of 600 m of each other (Location: 5°18.0660'N and 110°4.5798'W, Water Depth: 3882 m).
Logging operations and data quality
Logging had to face scientific as well as drilling and technical related questions (Table). Hole 1243A was drilled and cased to a depth of 224 mbsf. Due to drilling difficulties no core was obtained from this hole. Hole 1243B was drilled and cored to a depth of 195 mbsf.
First measurements were performed in Hole 1243B with the following runs:
- Triple-Combo tool string included the Accelerator Porosity Sonde (APS), the Dual Laterolog (DLL), the Hostile Environment Natural Gamma Sonde (HNGS), the High Temperature Lithodensity Tool (HLDT), and the Temperature/Acceleration/Pressure Tool (TAP).
- FMS/Sonic tool string included the FMS (Formation Micro-Scanner), the GPIT (General Purpose Inclinometry Tool), the DSI (Dipole Sonic Imager) and the NGT (Natural Gamma Ray Tool).
- Well Seismic Tool (WST).
After the ship was moved back to Hole 1243A, measurements were performed for hole deviation as well as cement bond quality, using the following tools:
- General Purpose Inclinometry Tool (GPIT).
- Cement Bond Tool (CBT) included the Cement Bond Log (CBL) and the Variable Density Log (VDL).
All tools (except the WST) were deployed in several passes to check data quality and log repeatability. Data from the WST were obtained from eight stations within the basement located about 10 m apart. About 5 -16 shots were stacked at each station to improve the signal-to-noise ratio.
Table 1. Leg 203 logging operations.
| Borehole | 1243A | 1243B | # of runs | |
|
Location
|
5° 18.0660'N, 110° 4.5798' W | 5°18.0551'N, 110°4.2542'W | ||
|
Water depth (mbsl)
|
3882.4 | |||
|
Drilling depth BOH (mbsf)
|
222.8 | 195.2 | ||
|
End of pipe EOP (mbsf)
|
84.6 | 79 | ||
|
Logging depth BOH (mbsf)
|
3-Combo
|
X | 181 | 2 |
|
FMS/Sonic
|
X | 181 | 2 | |
|
WST
|
X | 181 | 1 | |
|
GPIT
|
205.6 | X | 1 | |
|
CBT
|
205.6 | X | 3 | |
Logging runs exhibited data of excellent quality and repeatability, in general. Measurements with the GPIT in Hole 1243A only provided hole deviation, while the strong induced magnetic field of the drill pipe might have lead to inaccuracy of the inclinometry measurements. The CBL and VDL recorded data that could be used to determine the depth of BOH (Bottom of Hole), the top of the cement and, to a certain extent, the bond quality.
In Hole 1243B data from the tool strings Triple Combo and FMS/Sonic as well as the WST were of excellent quality. The TAP tool gave no results, probably caused by an internal technical failure. In the upper 114.5 mbsf (sediment section), the calipers of the HLDS and the FMS reached their maximum aperture of 18". Degraded hole width mainly affected DSI and FMS measurements, while all other logs were of very good quality. Several attempts of FMD (First Motion Detection) with the DSI gave no results, for unknown reasons. Delta-T compressional and Delta-T shear waves obtained from the monopole transducer gave results only in the basement section, but still of poor quality. Delta-T shear waves from the upper dipole transducer only recorded variations in some structural and/or lithological changes.
Results of Hole 1243A
Measurements with the GPIT resulted in a hole deviation of <1° (Figure 2). All three CBL runs determined a bond/no-bond interface at 4037 mbrf (154.6 mbsf) and confirmed the BOH at 4088 mbrf (205.6 mbsf).
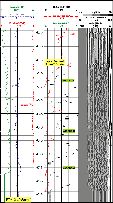
Figure 2. Full waveform images from the CBT sonic tool, covering a depth interval of 4023 - 4088 mbrf. The CBT records amplitudes as well as transit times in 3' (CBL) and 5' (VDL) spacings (Hole 1243A).
Bond quality is designated by a correlation to the amplitude response of the CBT: lower amplitudes represent good cementing quality. Low amplitudes can also be produced by other effects, such as tool decentralization, or casing collars/joints. Good bond, as seen in relation to no/poor bond areas, can be most likely detected in the following depth ranges: 157.6 - 162.6 mbsf (4040 - 4045 mbrf), 175.6 - 180.6 mbsf (4058 - 4063 mbrf), and 188.6 - 196.6 mbsf (4071 - 4079 mbrf). Due to the fact that higher amplitude readings can be observed periodically, these areas might be also dedicated to the influence of the casing joints. Thus, the quality estimations have to be regarded with care. Observations from VDL readings, which 'look' deeper into the formation, might help to distinguish between artificial effects (e.g. casing joints), and 'real' bond quality. Readings below 200.6 mbsf (4083 mbrf), although indicating a good bond zone, have to be interpreted with caution due to the fact that the tool starts recording a few meters above the actual logging depth measurement at the bottom end.
Results of Hole 1243B
The core derived lithology has been shifted 6.3 m downward to match with the logging data (Figure 3). The sediment-basement interface was detected at 114.5 mbsf (3982.5 mbrf) by most of the wireline measurements: Porosity decreases from values of avg. 89.2% (± 9.6%, max. 100%) in the sediment section to avg. 14.8% (± 4.6%, min. 6%) in the basement. In turn, density and resistivity increase. Density from avg. 1.50 g/cm3 (± 0.10 g/cm3, min. 1.11 g/cm3) in the sediments to values of avg. 2.59 g/cm3 (± 0.25 g/cm3, max. 3.07 g/cm3) in the basement. Resistivity shows very low values of avg. 0.59 ohmm within the sediment (min. 0.26 ohmm), increasing to values of avg. 21.09 ohmm (max. 48.33 ohmm) in the basement. The detection of a sediment layer by core lithology at a depth of 116 - 117 mbsf can be confirmed by porosity and density data. Porosity shows a slight increase to values of max. 28.9 % as well as lower density readings of avg. 1.96 g/cm3 (min. 1.73 g/cm3) compared to the surrounding basalts.
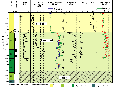
Figure 3. Composite plot of downhole measurements in the sediment and basement section (Hole 1243B). The core lithology has been shifted 6.3 m down to match the log derived depths.
The amplitude of the sonic waveform in dipole acquisition mode (DAM) shows a decrease in slowness from 180 - 200 µs/ft in the sediments to 140 - 170 µs/ft in the basement (Figure 4). The sonic waveforms, as inferred from the monopole acquisition mode (MAM), show only minor response with low coherency in the sediments, and often in the basement as well. Shear waves recorded in this mode yielded poor data in general. The end of the mud wave from the sediment into the basement can be regarded as the only qualitative indicator of the beginning of the basement. The first qualitative coherent detection of p-wave velocity can be discovered at a depth of 124 mbsf (3992 mbrf).
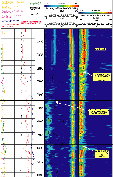
Figure 4. Full waveform images from the DSI sonic tool, covering a depth interval of 3965 - 4021 mbrf (Hole 1243B).
In contrast, no abrupt transition could be determined from total gamma ray at the specified interface (Figure 3). Within a depth range from 82 - 140 mbsf gamma ray measurements with an avg. response of 5.73 gAPI showed little variation of ± 2.96 gAPI. The maximum value of 11.1 gAPI within this section was determined at 130 mbsf. Gamma ray response is mainly controlled by the potassium content of the formation (Figure 5). Thorium and uranium show minor variations, and are roughly anti-correlated.
Figure 5. Gamma ray response in comparison to potassium, thorium, and uranium readings in the basement section. The increase in gamma ray at 141.5 mbsf can be related to a unit change.
From a depth of 141.5 mbsf the gamma ray response increases rapidly up to values of avg. 18.9 gAPI (± 1.6 gAPI, max. 23.0 gAPI). This change correlates with a unit change in core lithology from aphyric (Unit 3) to sparsely olivine-plagioclase phyric basalts (Unit 4). Within the first 3 m uranium still remains low (ca. 0.1 ppm), but increases to ca. 0.7 ppm at 144.5 mbsf, while potassium decreases below 0.6 %. Potassium remains low until 155 mbsf, with values of ± 0.6%. In that zone, thorium and uranium, partly alternating with each other, are the inferred elements in the total gamma ray reading. Below 155 mbsf the uranium response appears to drop below the detector resolution, while potassium increases again, reaching its maximum of 1.2% at 159.2 mbsf. These effects are most likely related to secondary changes within the basalt succession. Lithological and structural effects such as vesicular and fractured zones (Figure 6) from Unit 3 to 4 and within Unit 4 might contribute to these secondary changes.
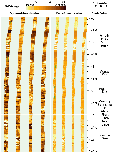
Figure 6. FMS image displaying a succession of pillow basalts. The transition between Unit 3 and Unit 4 formations can be observed at a depth of 140.8 mbsf.
Data from the WST used to conduct a check shot-VSP seismic survey through the basement section (Figure 7) show a good correlation of the velocities in the laboratory samples, the sonic log, and the well seismic data. On average, the laboratory velocities turn out to be slightly higher (5.26 km/s) than the velocities recorded by the sonic log, which average 4.72 km/s. The difference between the laboratory velocities and the sonic log probably reflects the presence of cracks in the formation that are not present in the laboratory samples. The WST interval velocities (average = 4.60 km/s) are slightly lower than the sonic log velocities. This difference could result from the presence of large-scale cracks affecting the seismic measurements but not the sonic log, which measures a smaller sample of the rock.
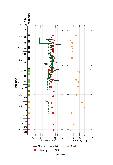
Figure 7. Porosities and measured sonic velocities in basalt samples recovered from Hole 1243B, plotted with the downhole sonic log and interval velocities computed from the WST survey. Also shown is the lithostratigraphy column. Logging and Well Seismic Tool (WST) depths have been adjusted to the coring depths. s.e. = standard error, T.D. = total depth.
Logging Scientist
Arno Buysch: Applied Geophysics, Aachen University of Technology, (RWTH-Aachen) , Lochnerstrasse 4-20, 52056 Aachen, Germany.